


When the School of Medicine established its Institute for Informatics in 2016, no one could have foreseen the indispensable role it would play in helping the St. Louis and campus communities respond to the COVID-19 pandemic.
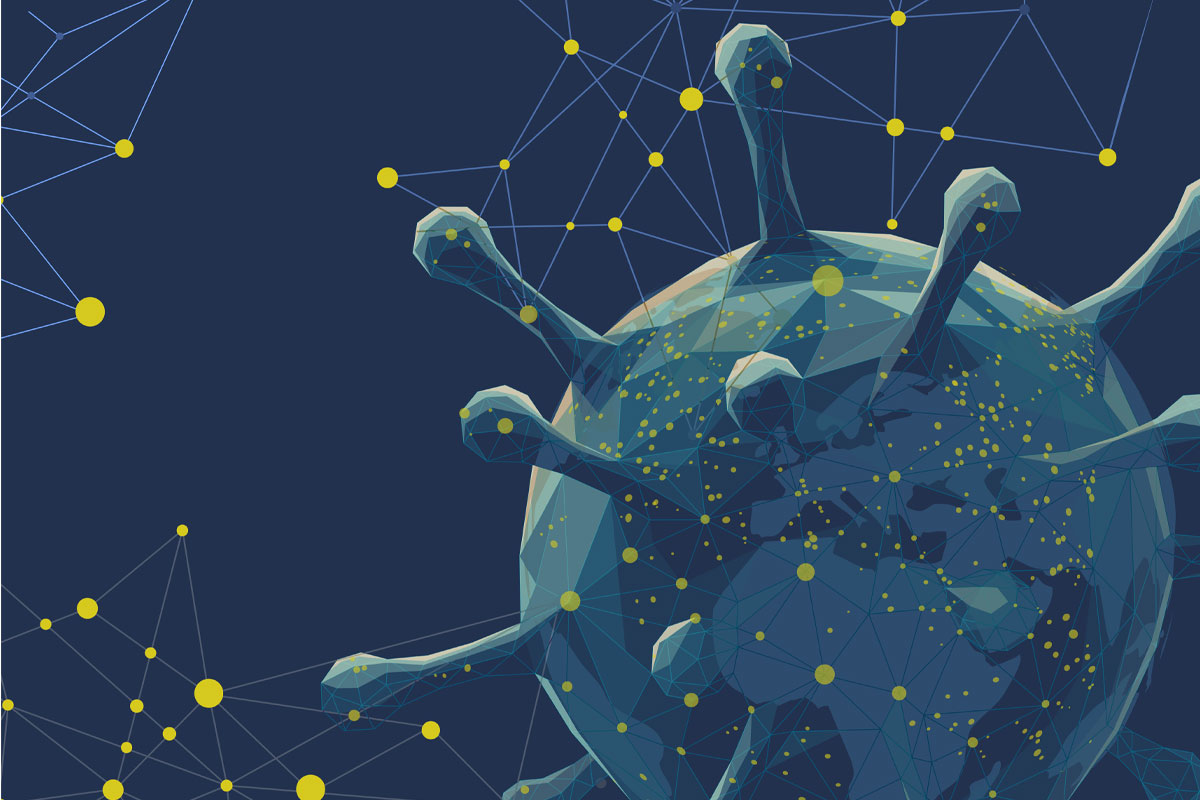
From the beginning, the pandemic has been a story told in numbers.
As harrowing stories of human suffering played out in factories, meatpacking plants and hospital emergency rooms, ordinary people the world over began calculating their pandemic fear factor based on the grim statistics of infection rates, case counts and deaths.
In St. Louis, health leaders watched anxiously as the pandemic drew closer and the numbers grew larger, rising inexorably and exponentially toward the realm of big data, toward the big challenges of population health that the Institute for Informatics (I2) was being built to address.
Philip R.O. Payne, PhD, founding director of I2 and a leader in clinical informatics and biomedical data science, was preparing for action.
His growing I2 team included experts in public health, epidemiology and biomedical informatics, as well as an army of data scientists, data brokers and database administrators — just the expertise necessary to track a pandemic and model its consequences.
Payne’s data team, in collaboration with an array of medical experts and community leaders, soon would become the analytic engine behind much of the science-based forecasting that continues to drive pandemic decision-making across the St. Louis region.
The I2 team, in partnership with analytics teams from regional health systems, would build the models that early in the pandemic gave local governments the evidence-based rationale to issue mask mandates, close schools and lock down public gatherings — decisions that published research since has shown to have saved countless lives.
Later, I2 programmers would help build online registration forms and computer databases to ensure that the first precious vaccine doses went to those who needed them most.
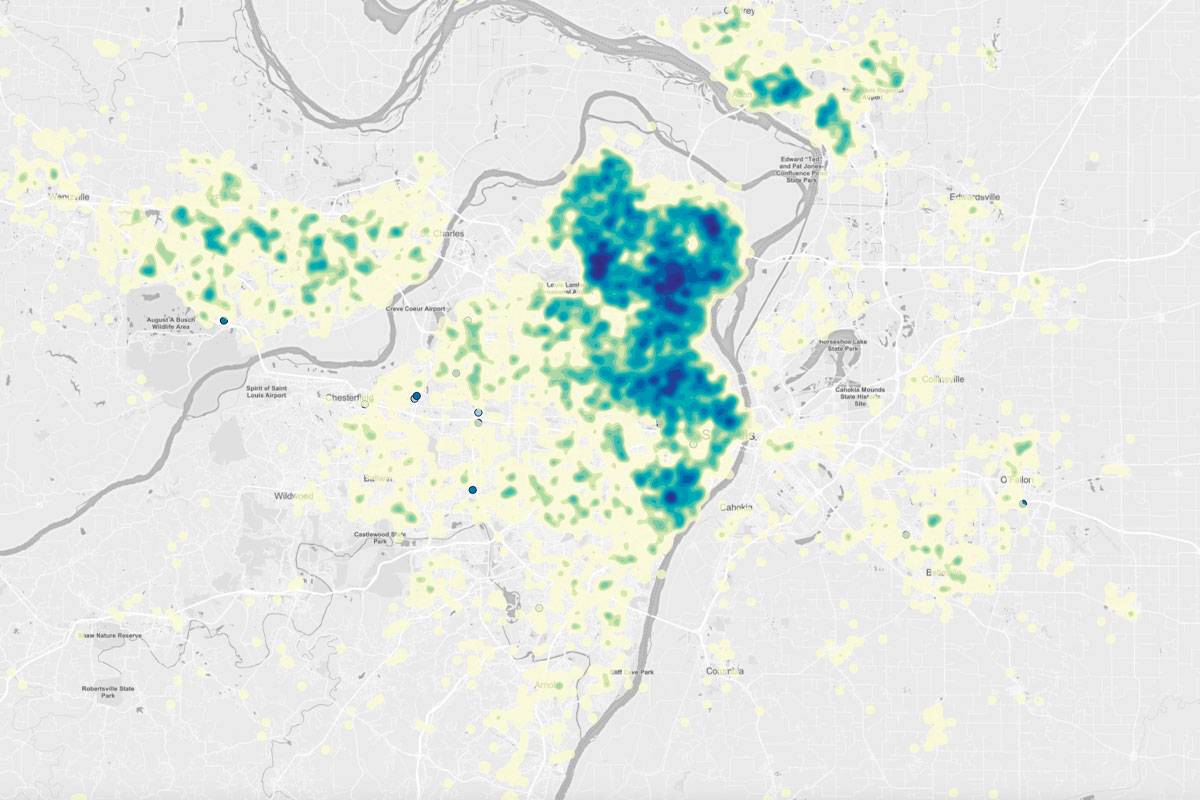
They would provide public health agencies with street-level heat maps of virus outbreaks so that pop-up testing clinics, outreach programs and educational interventions could be focused on the low-income, underserved neighborhoods hit hardest by the pandemic.
And with unprecedented “hackathon” speed, a team of I2 programmers would stand up the smartphone-friendly interface behind a saliva-based, rapid testing system that helped keep front-line medical workers safe and allowed students back on campus.
While much of this data analytics support work went on behind the scenes, its contributions did not go unnoticed by front-line health-care workers and local leaders making tough, daily pandemic decisions.
“I truly believe the analytics team, which included the Institute for Informatics at Washington University, was one of the unknown crown jewels of the Pandemic Task Force,” said Alex G. Garza, MD, chief community health officer at SSM Health and commander of the St. Louis Metropolitan Pandemic Task Force (PTF).
“The institute in particular was able to give us sophisticated insights into the pandemic, including where the cases were coming from and identifying at-risk populations,” said Garza, who led weekly news briefings through much of the pandemic.
“We would not have been nearly as successful in understanding the challenges of COVID-19, and providing communications to the public, had it not been for their expertise.”
A single source of truth
In January 2020, as the virus was spreading in China, Payne began getting nail-biting phone calls from infectious disease specialists and other informatics scientists across the globe who could see what might be coming and were worried about readiness.
Payne, who serves as the Janet and Bernard Becker Professor and associate dean for Health Information and Data Science, joined other leaders from the School of Medicine, BJC HealthCare and Washington University Physicians to plan for an outbreak. These groups formed a Joint Incident Command Center for the BJC HealthCare system.
Likewise, clinical leaders from other regional hospital networks began communicating before the first case was found in St. Louis, and soon were joined by the health-care system CEOs, laying the groundwork for an unprecedented, collaborative effort.
Local elected officials and their public health directors also were brought into the conversation, leading to the formation of the PTF.
Early in the group’s formation, it was understood that the PTF needed a single source of truth for data and analytics. The leaders realized there was no current reliable system in place to gather regional pandemic data. If a pandemic brought patients flooding into emergency rooms, or hit certain populations more severely than others, it would be challenging for local leaders to get a handle on what was happening across the metropolitan area or for the PTF to inform the public about what it was seeing.
Payne soon received a call from Clay Dunagan, MD, BJC’s senior vice president and chief clinical officer and a professor of infectious diseases. With that conversation, the Incident Command Center added a data analytics function to be co-led by Payne, chief data scientist at the medical school, and Keith Woeltje, MD, chief medical information officer at BJC (who later left the institution). Deborah O’Dell, chief data officer at BJC, along with Jordan Shapiro at BJC’s Center for Clinical Excellence, assumed leadership following Woeltje’s departure.
Their mission: Develop the systems necessary to collect rapidly evolving critical pandemic response data, streamline its format and store it in a central depository where it could be analyzed and accessed by authorized users.
BJC’s team brought a wealth of existing patient information and analytics expertise to the table through both the hospital network’s electronic health records (EHRs) and its business intelligence capabilities. O’Dell and Shapiro already had been developing data and analytics solutions to support patient care and health system operations during the pandemic.
I2 brought expertise working with research partners across campus in managing big data sets and supporting their analysis with sophisticated artificial intelligence tools.
Key players on Payne’s I2 team include Albert M. Lai, PhD, deputy director at I2 and chief research information officer for the School of Medicine, and Randi E. Foraker, PhD, associate director at I2, director of I2’s Center for Population Health Informatics and a professor of medicine and professor at the Brown School.
Foraker, a cardiovascular disease epidemiologist whose research focuses on the prevention of chronic diseases, brought years of experience forging data-sharing agreements among external partners.
Her first priority was finding a way to unlock the treasure trove of patient demographic and health data stored in the regional hospitals’ electronic record systems. EHRs offer incredible opportunities for developing real-time, data-driven insights on pandemic trends, but getting access poses huge challenges.

Locked behind high-security firewalls as dictated by federal privacy laws and held close to the vest for competitive reasons, this sort of patient health data had never been freely shared among the region’s health providers.
Foraker called a special meeting to discuss data-sharing with the leaders of local public health agencies and hospital networks, most of whom brought their lawyers.
Rather than negotiate dozens of one-to-one data-sharing contracts, Foraker proposed an arrangement where all parties would provide their data to a single “honest broker” who would be contractually obligated to safeguard their data interests with anyone requesting access.
She volunteered the Institute for Public Health to serve as the “honest broker” and I2 as the central data repository. Within days, the data logjam was broken.
“It is important to recognize that her big win here was in negotiating with all the health systems and their attorneys and privacy officers to even share their data so that epidemiological models could be generated,” Payne said.
“For all of Dr. Foraker’s scientific and computational prowess, the primary challenge here wasn’t a technical one. What she achieved was getting all the health systems to agree to a model where we would create a safe space to put data together — engineering a paradigm shift in data-sharing culture at the regional level literally overnight. It’s an incredible accomplishment and one that illustrates what the future of data-driven public health can and should look like.”
Foraker also reached out to leaders and staff at 16 city and county health departments, forming a networking group known as the Epidemiology Strike Force. She met weekly with the group to discuss data-sharing agreements and time-saving technical solutions for critical tasks, such as case identification contact tracing and the use of geospatial mapping to identify hot spots.
Foraker called on I2 programmers to develop free, easy-to-use open-source computer programs designed to fill gaps in the data management needs of local health departments and collaborated with Paul Sorenson, director of the St. Louis Regional Data Alliance at the University of Missouri-St. Louis, to make these tools available to other pandemic response groups.
Lai, an expert in informatics infrastructure, manages dozens of research databases and oversees I2’s core services team of software engineers, database administrators, data analysts and bioinformaticians.
In August 2020, when the Department of Genetics and the McDonnell Genome Institute co-developed a saliva-based rapid COVID-19 test, Lai’s special projects team quickly stood up a user-friendly computer interface to handle sample submission and reporting functions — a system that was essential in bringing students back into dorms that fall.
Lai’s team also worked closely with Student Health and Occupational Health to develop the campus daily health self-screening tool and other pandemic-related dashboards and reporting tools that were used to keep the campus and workplace safe.
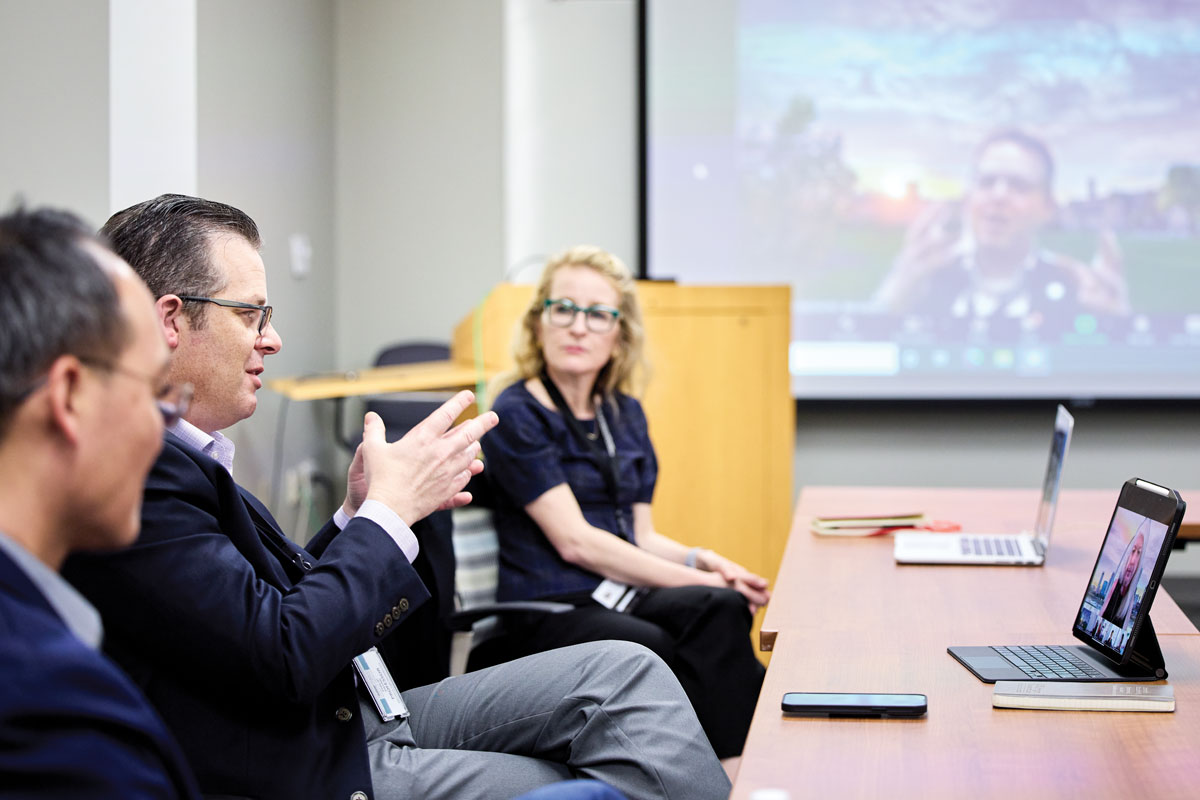
As the pandemic surged, most of I2’s ongoing research got put on hold so its workforce could support data-sharing, data visualization and predictive modeling around COVID-19. I2 teams, along with other regional hospital networks, participated in real-time pandemic analysis.
This multisystem collaboration produced one regional COVID-19 scorecard on behalf of all the major health systems, helping providers learn from each other and sending a unified message about what was going on in the community.
“I think we gained a lot of credibility with public health officials and agencies by speaking with one voice as the health-care system rather than competing with one another on projections,” Shapiro said. “It allowed us to use data analytics in a way that drives public policy decision-making.”
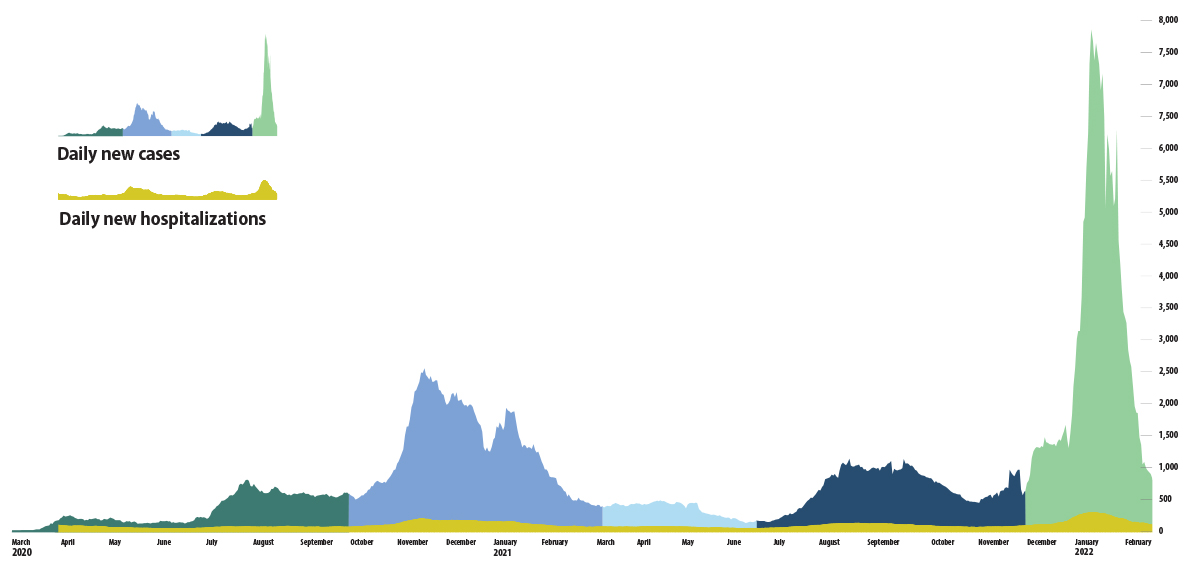
At I2, the daily reporting took on an “all-hands-on-deck,” 24/7 urgency driven by the realization that people could die if the pandemic modeling went wrong. It was an intense, daily immersion in getting and making sense of the latest data. How many beds do we have? How many ventilators? How many doctors do we need in the ICU this weekend?
“We really used our informatics to guide operational decision-making within the health-care system,” Shapiro said. “We produced weekly projections about what will happen to our hospital census, the number of patients who are COVID-19-positive in our system, and that was used to make decisions about whether we needed to defer elective care, or whether we needed to add additional staff or change our nurse-to-patient ratio to cope with the increased COVID-19 demand.”
Payne, Foraker and Lai realized that they had to maintain a razor-sharp focus on the urgency of the moment.
A new era in data-sharing
The pandemic has shown how essential the sharing of patient data can be for making informed, real-time decisions.
“Our experience has shown that there are responsible, privacy-preserving ways of sharing data for the greater good,” Payne said. “Why would we return to siloed information and incomplete regional pictures on a whole range of public health and health-care issues? Not sharing patient data actually does a disservice to the health of real people in our community.”
Prime examples of the continued need for patient data-sharing, Payne said, are the “long-hauler” COVID-19 patients who struggle with a range of post-acute symptoms.
Long COVID-19 patients with debilitating symptoms are showing up for treatment at local hospitals, but Payne worries that patients with more subtle symptoms may never be diagnosed. He’s seeking funding for a study that would use big data to identify “unknown” long COVID-19 patients based on symptoms they discuss with primary care physicians.
For Foraker, the success of big data analysis during the pandemic illustrates how these tools might benefit the community going forward.
“The partnerships and data-sharing infrastructure that we’ve built have been critical for dealing with a fast-paced pandemic, but they are also critical to the future health of our region, so that we can tackle chronic diseases — such as diabetes and cancer — in the region,” Foraker said.
For Payne, the pandemic response has made it clear that big-data number crunching is not incompatible with compassionate, human-focused health care.
“I think we have fundamentally reshaped how our leaders and how our clinicians and how our community members think about the role of data in driving health and wellness. Before it was very abstract. It’s not abstract anymore.” Big data has proven its value in a pandemic driven by urgency, but the real question is what comes next?
“We have a huge number of problems to tackle, and they’re all amenable to using our data to make smarter, faster decisions. And we’ve gained trust in using these big data technologies during the pandemic to make really, really hard decisions, sometimes life-or-death decisions,” Payne said.
“So that opens up the door to a very different way of running our health-care system and of thinking about public health and how we engage with the communities around us. And I think that’s the lesson.”

Your smartphone can alert you if you’ve been near another MO/Notify app user who has tested positive for COVID-19. The Institute for Informatics launched MO/Notify, a smartphone system that privately sends pop-up alerts to users in Missouri. On Android, find the app on Google Play. On iPhone, opt-in to Exposure Notifications in Settings > Exposure Notifications on the device.
 Share
Share Tweet
Tweet Email
EmailPublished in the Summer 2022 issue